A transformer classifier runs every input through its full stack of layers — an easy example and a hard one cost exactly the same. But the easy ones are often already decided halfway up. The depth spent past that point is wasted compute, and on a laptop that is wasted battery.
This project rebuilds a prior simulation ("JouleRoute v1") on real model weights. The earlier version modelled the idea; this one attaches working early-exit heads to a real BERT-base encoder and asks the only question that matters on hardware: does stopping early save measurable energy, and what does it cost in accuracy?
"An easy sentence should not cost the same as a hard one — and the only way to know what it really costs is to measure the joules."
The lineage is explicit. BranchyNet (2016) introduced early-exit branches gated by prediction entropy; DeeBERT (2020) applied the idea to BERT — freeze the backbone, train a small off-ramp after each layer, and exit the first time one is confident. I follow DeeBERT closely, then add the v1 continuity hook: a simulated battery budget that tightens the exit threshold as it depletes.
Scope is deliberately narrow and honest: encoder classification only — BERT-base, 12 layers, SST-2 sentiment. Decoder / generative early-exit is a real research frontier, not this experiment; why it is hard is the last word of the page.
Freeze the backbone, train only the off-ramps, then route by confidence. Three setups isolate what early-exit — and the battery budget — actually contribute, each measured against the full-depth baseline.
Everything runs on an M5 MacBook Air via the MPS backend. The backbone is frozen, so I cache its per-layer features once and train the 12 linear heads on top — cheap, reproducible, seeded. The depth gradient is the whole premise: head accuracy climbs from ~72% at layer 1 to ~92% by layer 10.
Energy is the part that has to be real. Every joule comes from a raw powermetrics capture written to a timestamped log — never estimated from layer counts. I measure energy-per-example at each fixed depth with identical full batches (constant GPU saturation), then weight by each threshold's real exit distribution. Three measurement methods were tried; two were discarded for confounds before the numbers were trusted.
Statistics run over 5 random seeds — the only randomness is head training; the backbone never moves. A paired permutation test compares early-exit against full-depth on the same sentences; a bootstrap puts a 95% confidence interval on the accuracy change, layers saved, and energy saved.
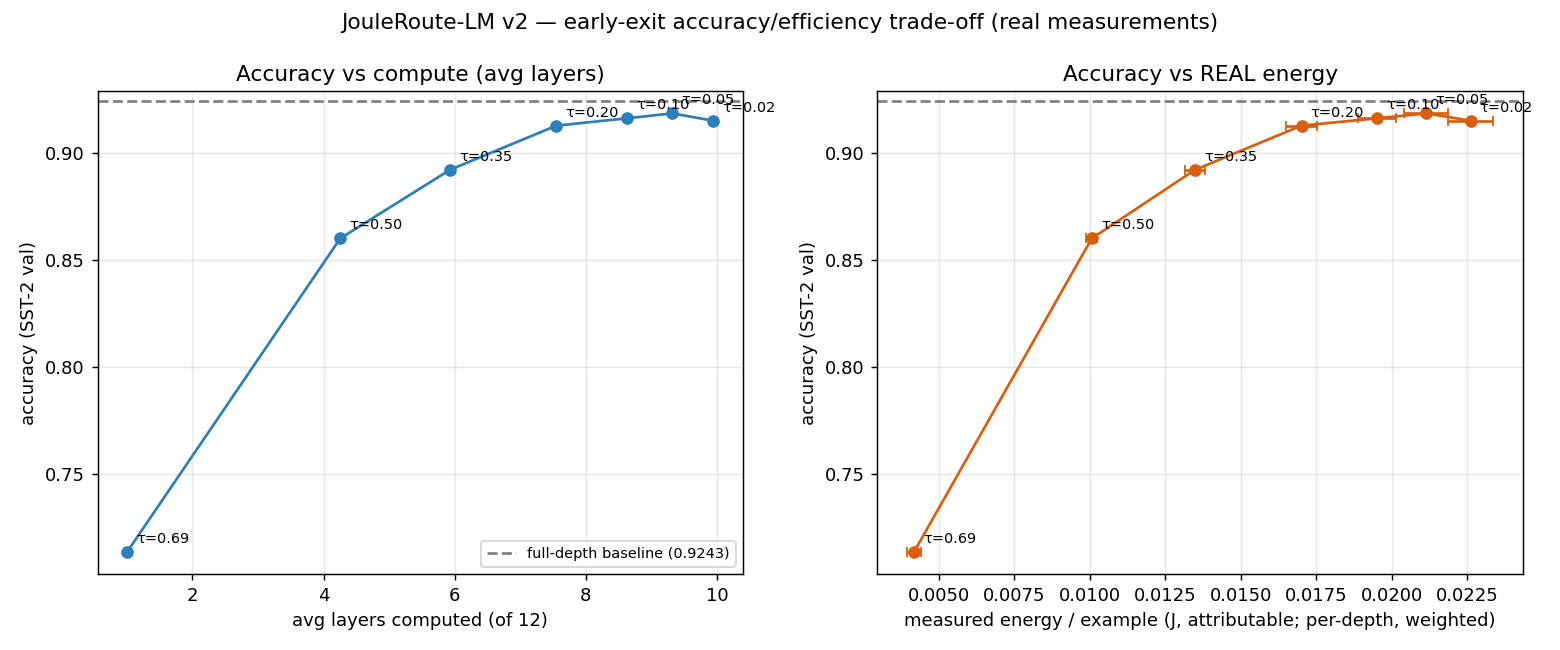
This is the whole project in one plot — accuracy against the compute and the real energy it costs. It is modest on purpose. A clean, dramatic number here would be a red flag; this is the honest shape.
At the sweet-spot threshold (τ = 0.20) the router computes 37% fewer layers and draws ~37% less measured energy per example, while holding 98.8% of the full-depth baseline accuracy (0.913 vs 0.924). The energy is real — it traces to powermetrics logs, not a layer-count estimate.
Across 5 seeds the accuracy change is not statistically significant: paired-permutation p-values stay ≥ 0.30 and the bootstrap 95% CI on Δaccuracy is [−1.15, +0.69] percentage points — it straddles zero. In plain terms: early-exit saved about a third of the compute and energy with no accuracy loss I can actually measure. That is the win.
Notice the energy saved (~37%) is no larger than the layers saved (~37%), and never beats it — embeddings, the layers you still run, and fixed overhead don't vanish, so energy scales sub-linearly with depth. If energy had dropped faster than compute, the measurement would be lying.
Push τ harder and the trade-off appears as it should: by τ = 0.50 you save ~65% of layers but accuracy falls to ~86%; exit at the very first layer and accuracy collapses to ~71%. The knee of the curve — not the extremes — is the operating point.
| Threshold τ | Accuracy | Avg layers | Energy saved |
|---|---|---|---|
| 0.05 | 0.919 | 9.32 | −22% |
| 0.10 | 0.916 | 8.63 | −28% |
| 0.20 | 0.913 | 7.55 | −37% |
| 0.35 | 0.892 | 5.93 | −50% |
| 0.50 | 0.860 | 4.25 | −63% |
| 0.69 | 0.713 | 1.00 | −85% |
Real weights, real hardware, auditable libraries — and nothing between the model and the power meter.
Three things worth stating plainly — including the ways the result is smaller, and more honest, than a headline would prefer.
What this experiment does not show, stated up front — and where it would have to go next.
An illustrative model of the routing decision on a 12-layer stack — not the benchmark. Set a sentence's difficulty, the entropy threshold τ, and the simulated battery, and watch where it exits versus full depth. The measured numbers are in the curve above.
Full overview of projects, disciplines, and work.
Full-stack FTC alliance selection platform. Monte Carlo, OPR, live match data.
More builds, experiments, and side projects.